Information visualization
Communications | Research | Collaboration
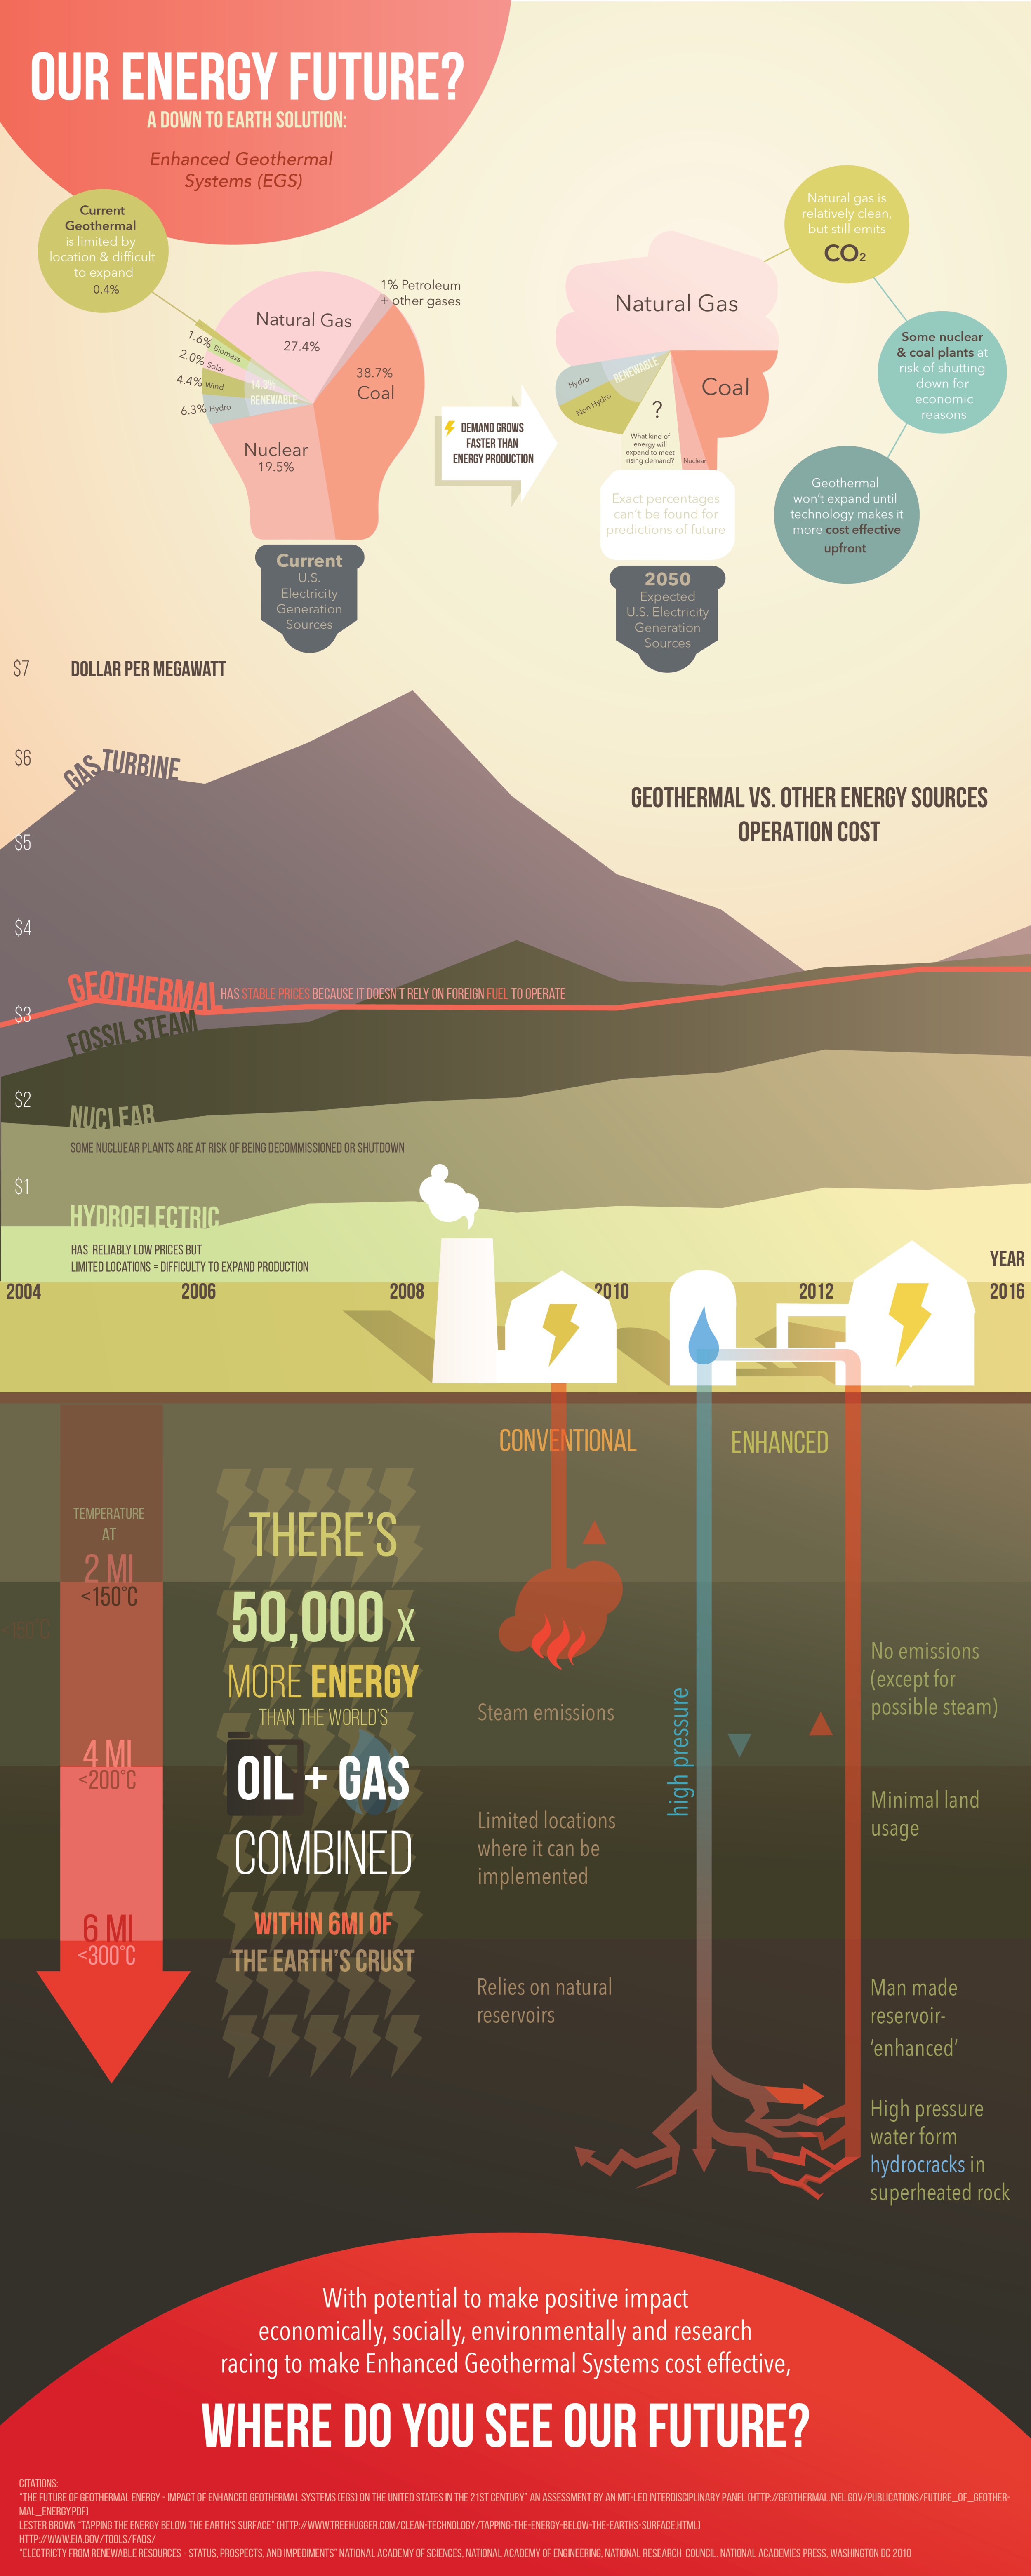
Grand Prize Infographic
The U.S. Department of Energy (DOE) along with the Center for Advanced Energy Studies (CAES) and Idaho National Laboratory (INL) launch a competition in the Spring that invites high school and university students to design an infographic that will tell a story about geothermal energy. I teamed up with classmates Marisa Lu and Tiffany Lai (Infinity and Below) for this personal project in our Spring semester of freshmen year. Personally, I was interested in this competition as I was initially hooked because in high school, I was a member of my school's Environmental Impact Club and wanted to continue my work with environmental issues in university. When Marisa told us about this challenge, I was eager to join. It was a good opportunity to combine my HS passions with what we learn in the classroom.
The competition had three rounds: create an infographic that showed the story of geothermal energy, refine and perfect your infographic, and develop + execute social media campaign to promote the infographic. We were able to successfully pass all rounds, despite hurdles such as time zone differences. The infographic on the left is the grand prize winning submission with a few minor edits.
We were lucky enough to be able to attend the Geothermal Resource Council's 40th Annual Meeting in Sacramento, CA during the Fall.
Process


The infographic challenge gave us the opportunity to tackle any topic regarding geothermal energy. We first started by individually researching topics that interested us. I looked into the history to future usages of geothermal energy and how it will affect the environment. As a group, we came back together in order to consolidate on one story line. As a whole we hoped to show a visualized story of our information. After multiple discussions, we narrowed down on the information to include. In order to successfully convey our tidbits of facts, we decided to target our infographic towards individuals such as ourselves: those who are not as aware of geothermal energy. We wanted to create a visually stimulating infographic.
Colour palette was decided as a group before we split the parts. We were each in charge of a section for the infographic and came together to splice it up. Final edits were made as a group all crowded over one computer.
After round one, we were assigned mentors for the design and the data. We made small edits to the infographic before submitting to round two. The most difficult aspect of this round was that edits were to be made on a single file.

Iterations of the infographic
Round 3
After the infographic was completed, round 3 was a social media campaign. The three of us needed to plan a way to spread our infographic through means such as social media. In order to accomplish this, we started by creating a Facebook page and targeted our personal Instagram audience. Every time we posted on our Facebook page, we would also target specific audiences such as our respective environmental impact clubs in high school and other groups such as my HS alumni.


We implemented creative marketing methods such as animation videos and a play on a dating app!